


Every team, one consistent view of the market.
See how the market has moved before you walk into a retailer meeting.
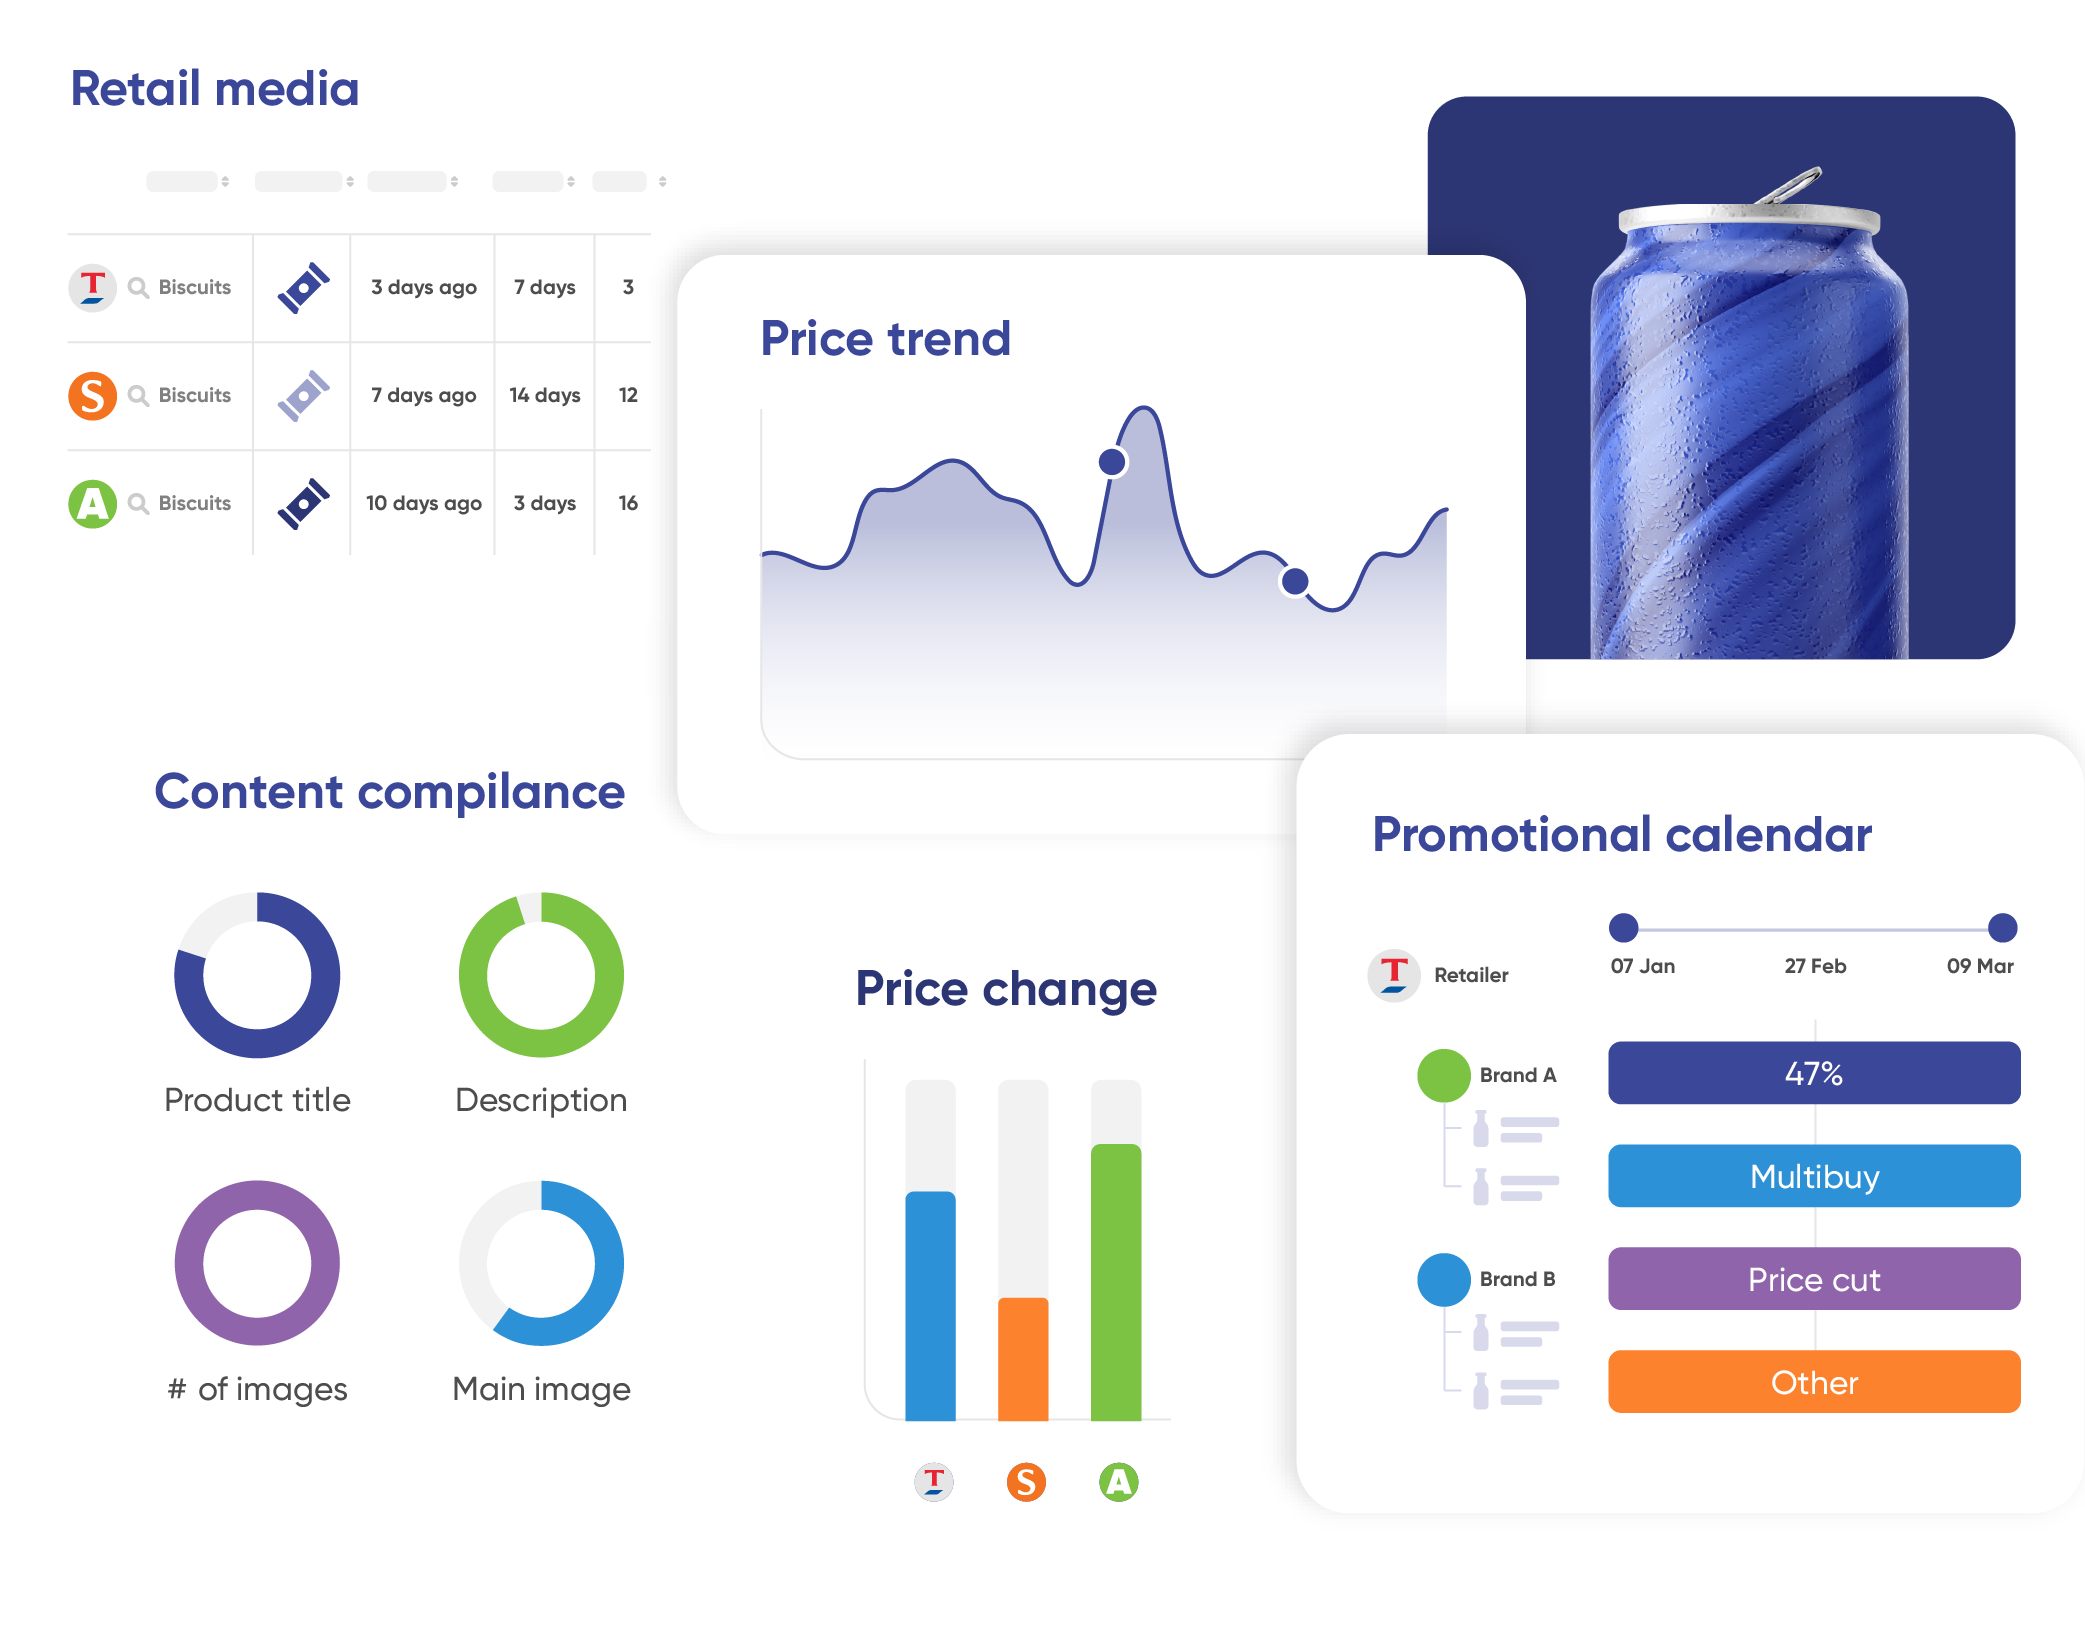
Daily price + promo data across every retailer in scope, normalised to one schema. Filter by retailer to confirm whether a movement is local or systemic.
A weekly margin-leak view ranks SKUs by cumulative price erosion vs. RRP, with the retailers and dates where the change happened.
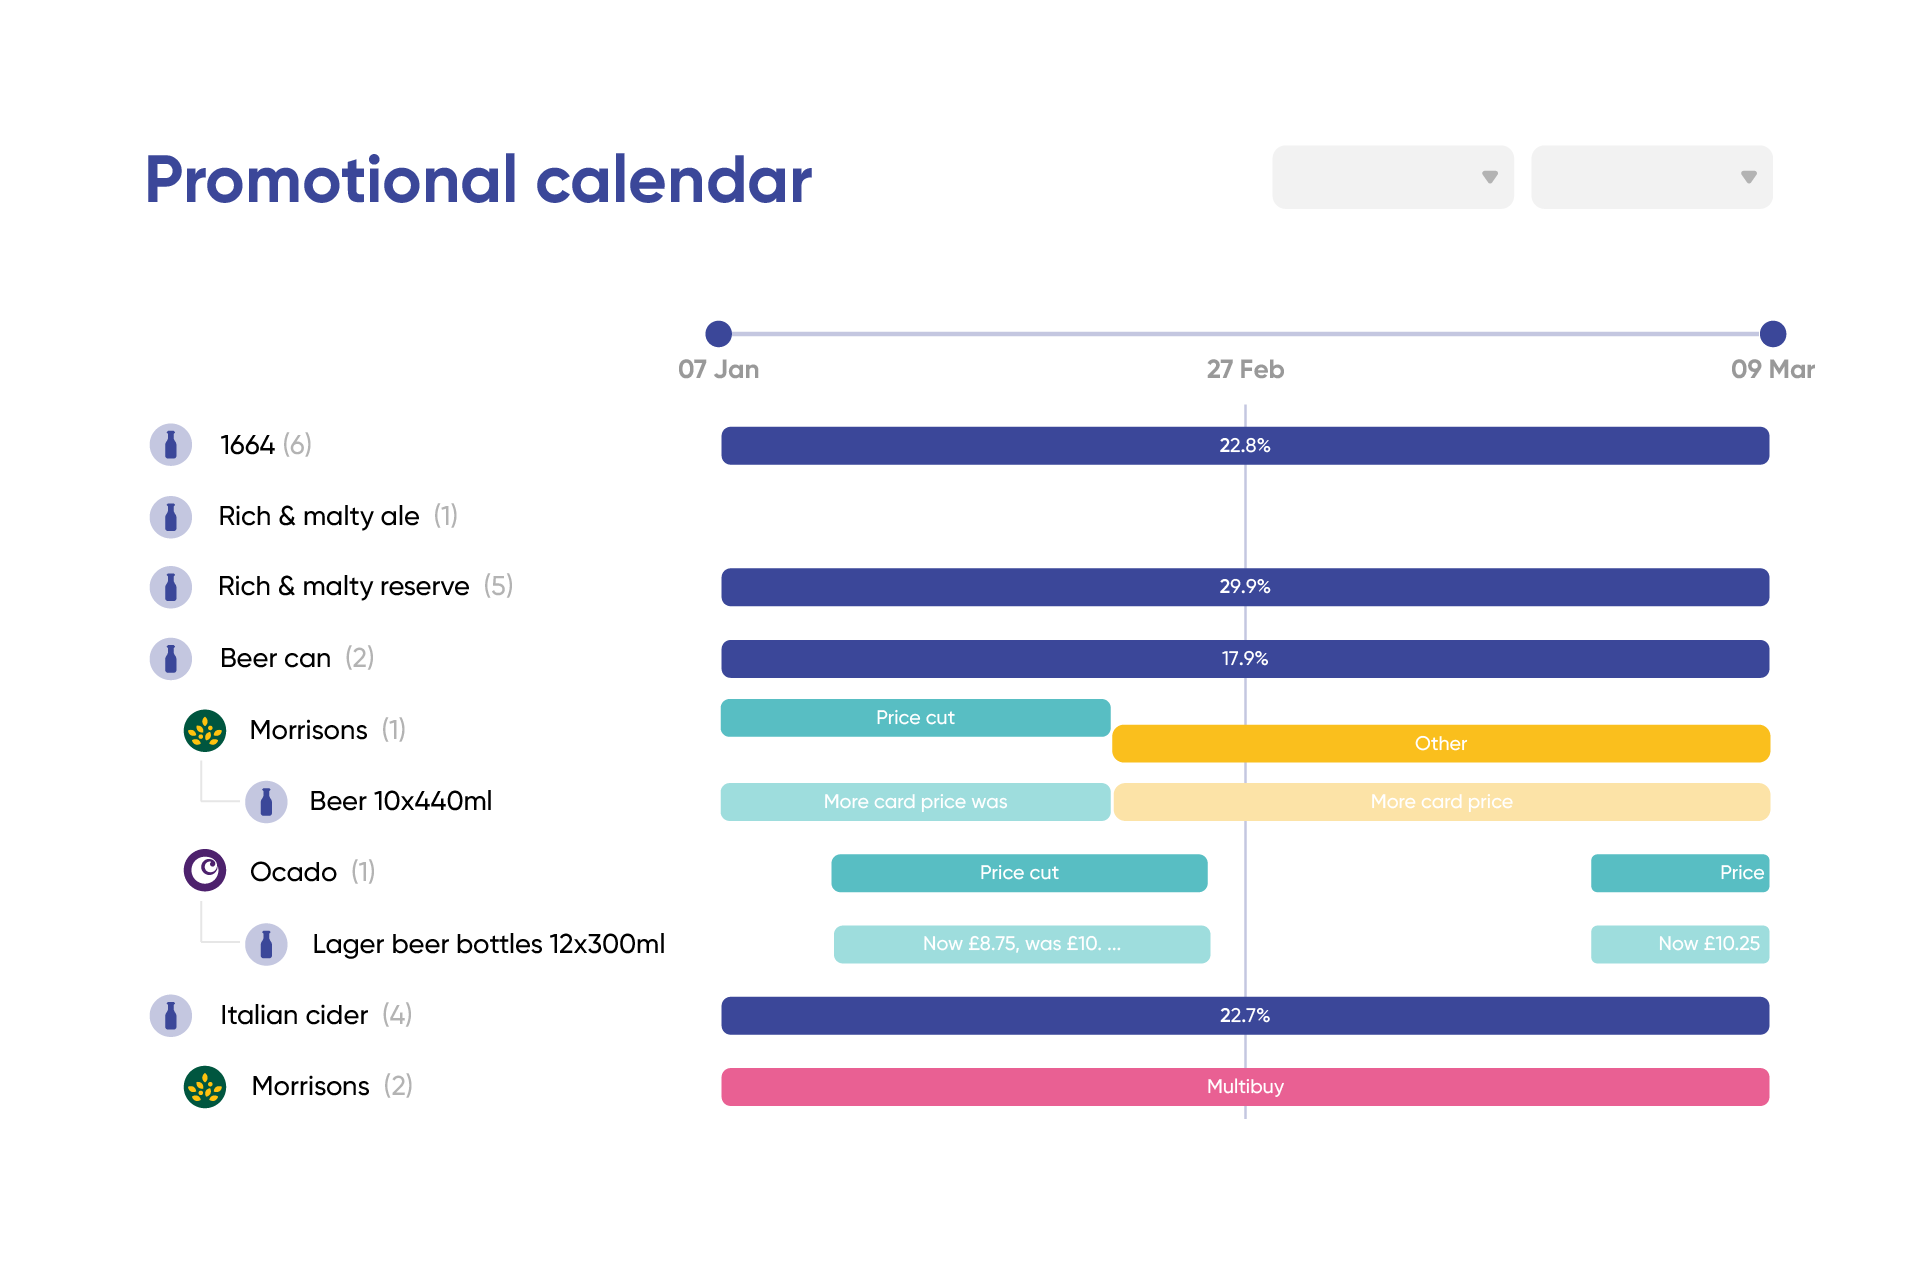
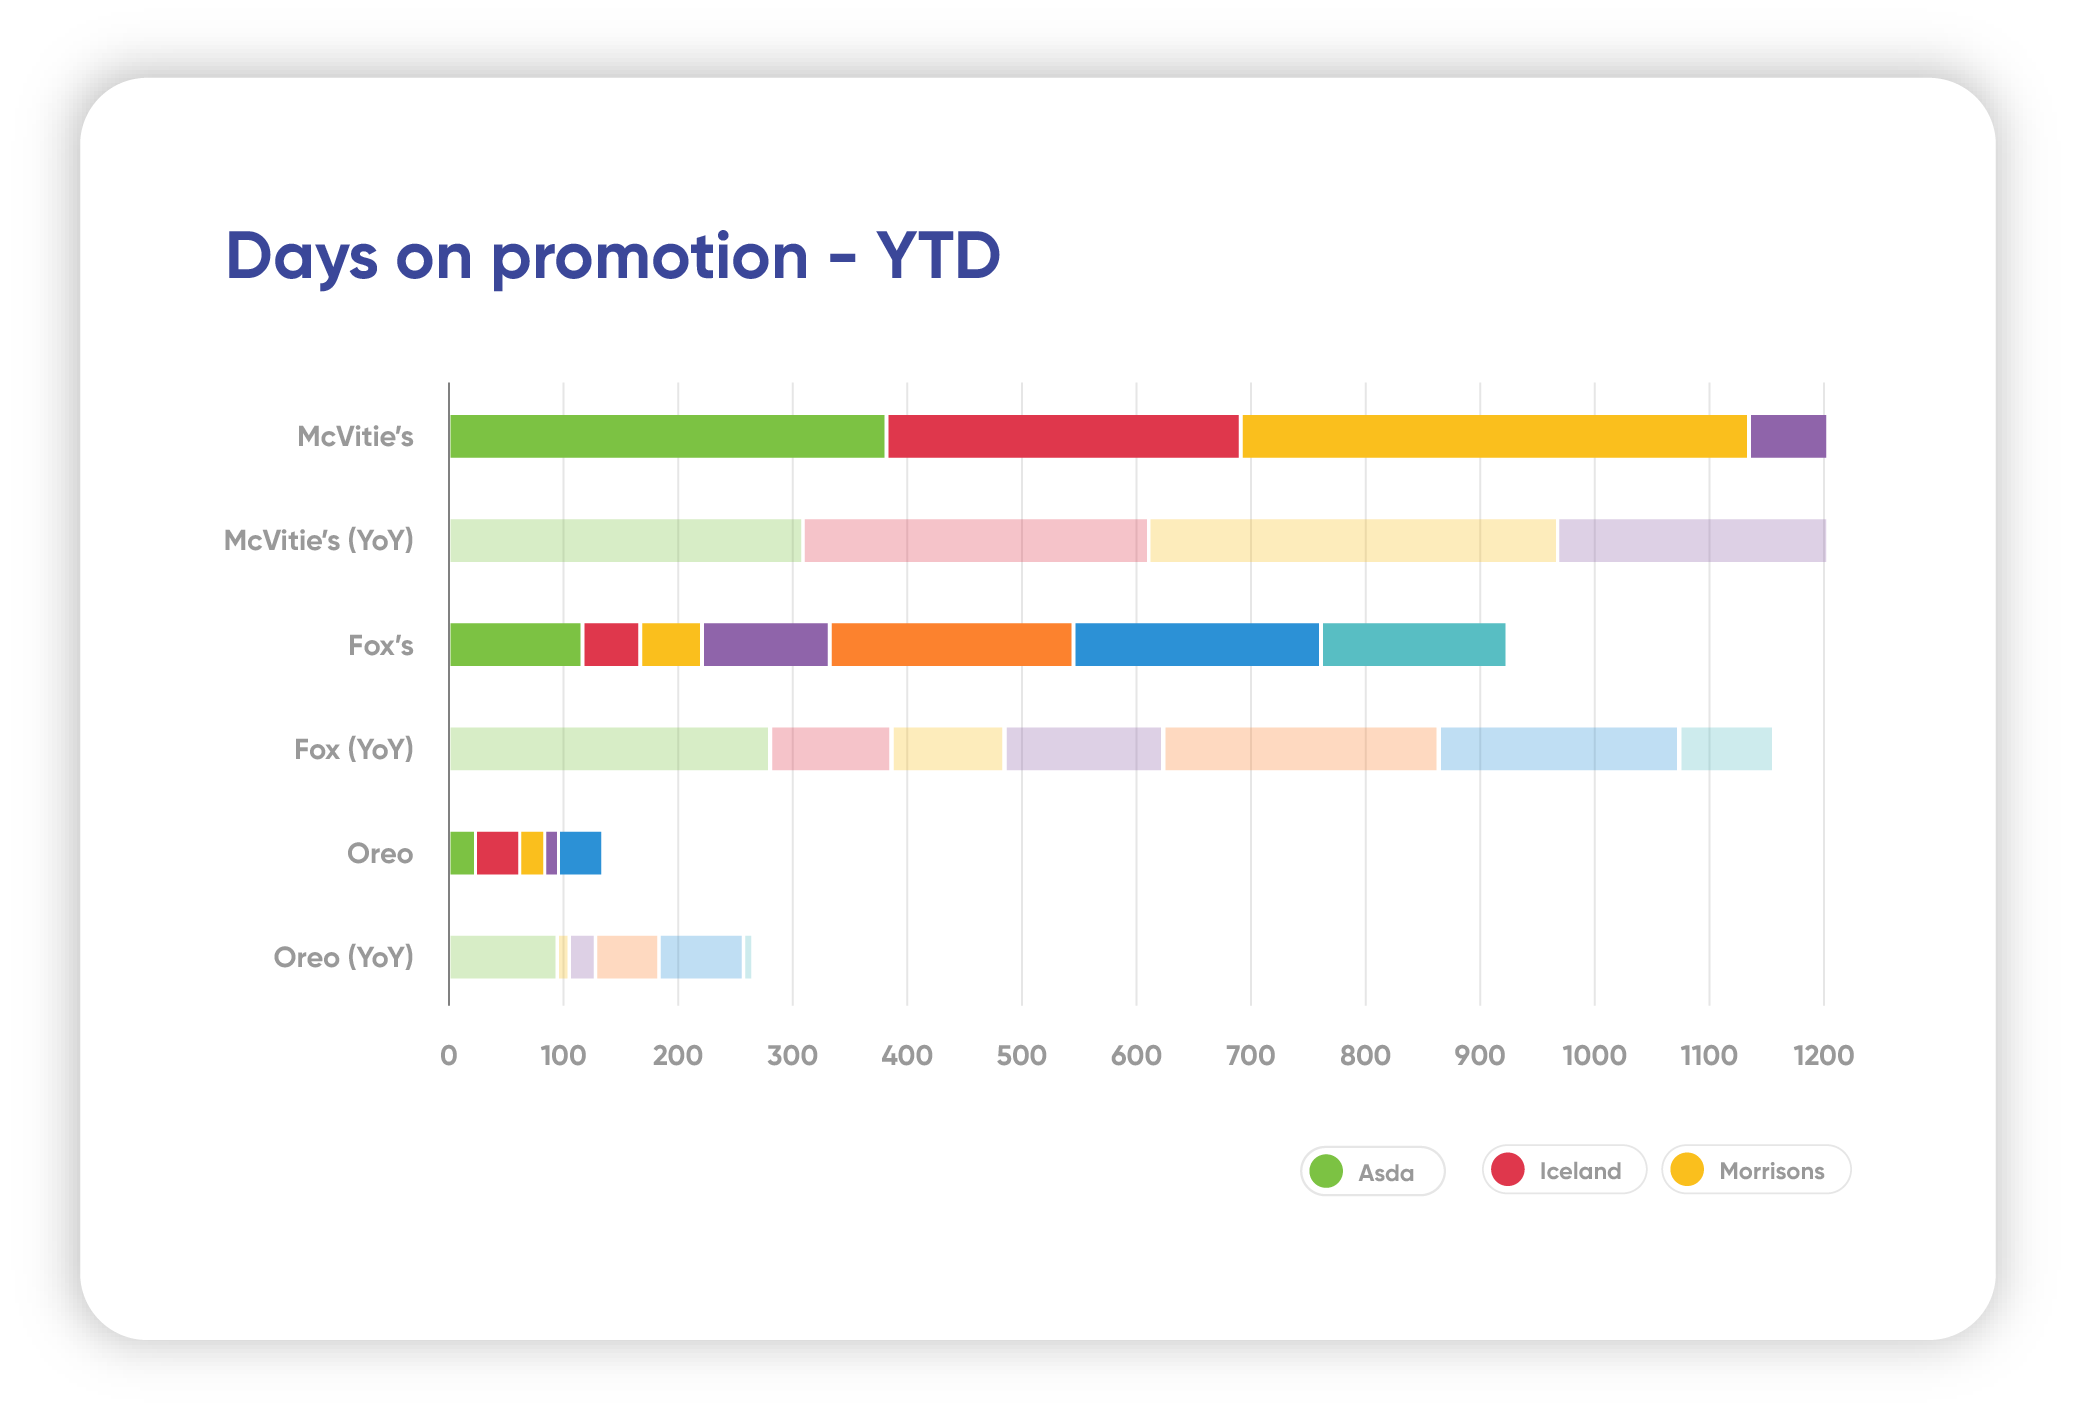
Promo calendars side-by-side. See depth, frequency and mechanic by competitor, by retailer, and by week.
Cross-retailer parity heatmap flags any SKU where price spread exceeds your tolerance, with the day it slipped.
Tighten your forecast with retailer-grade data. Spot the signals that move volume before they show up in EPOS.
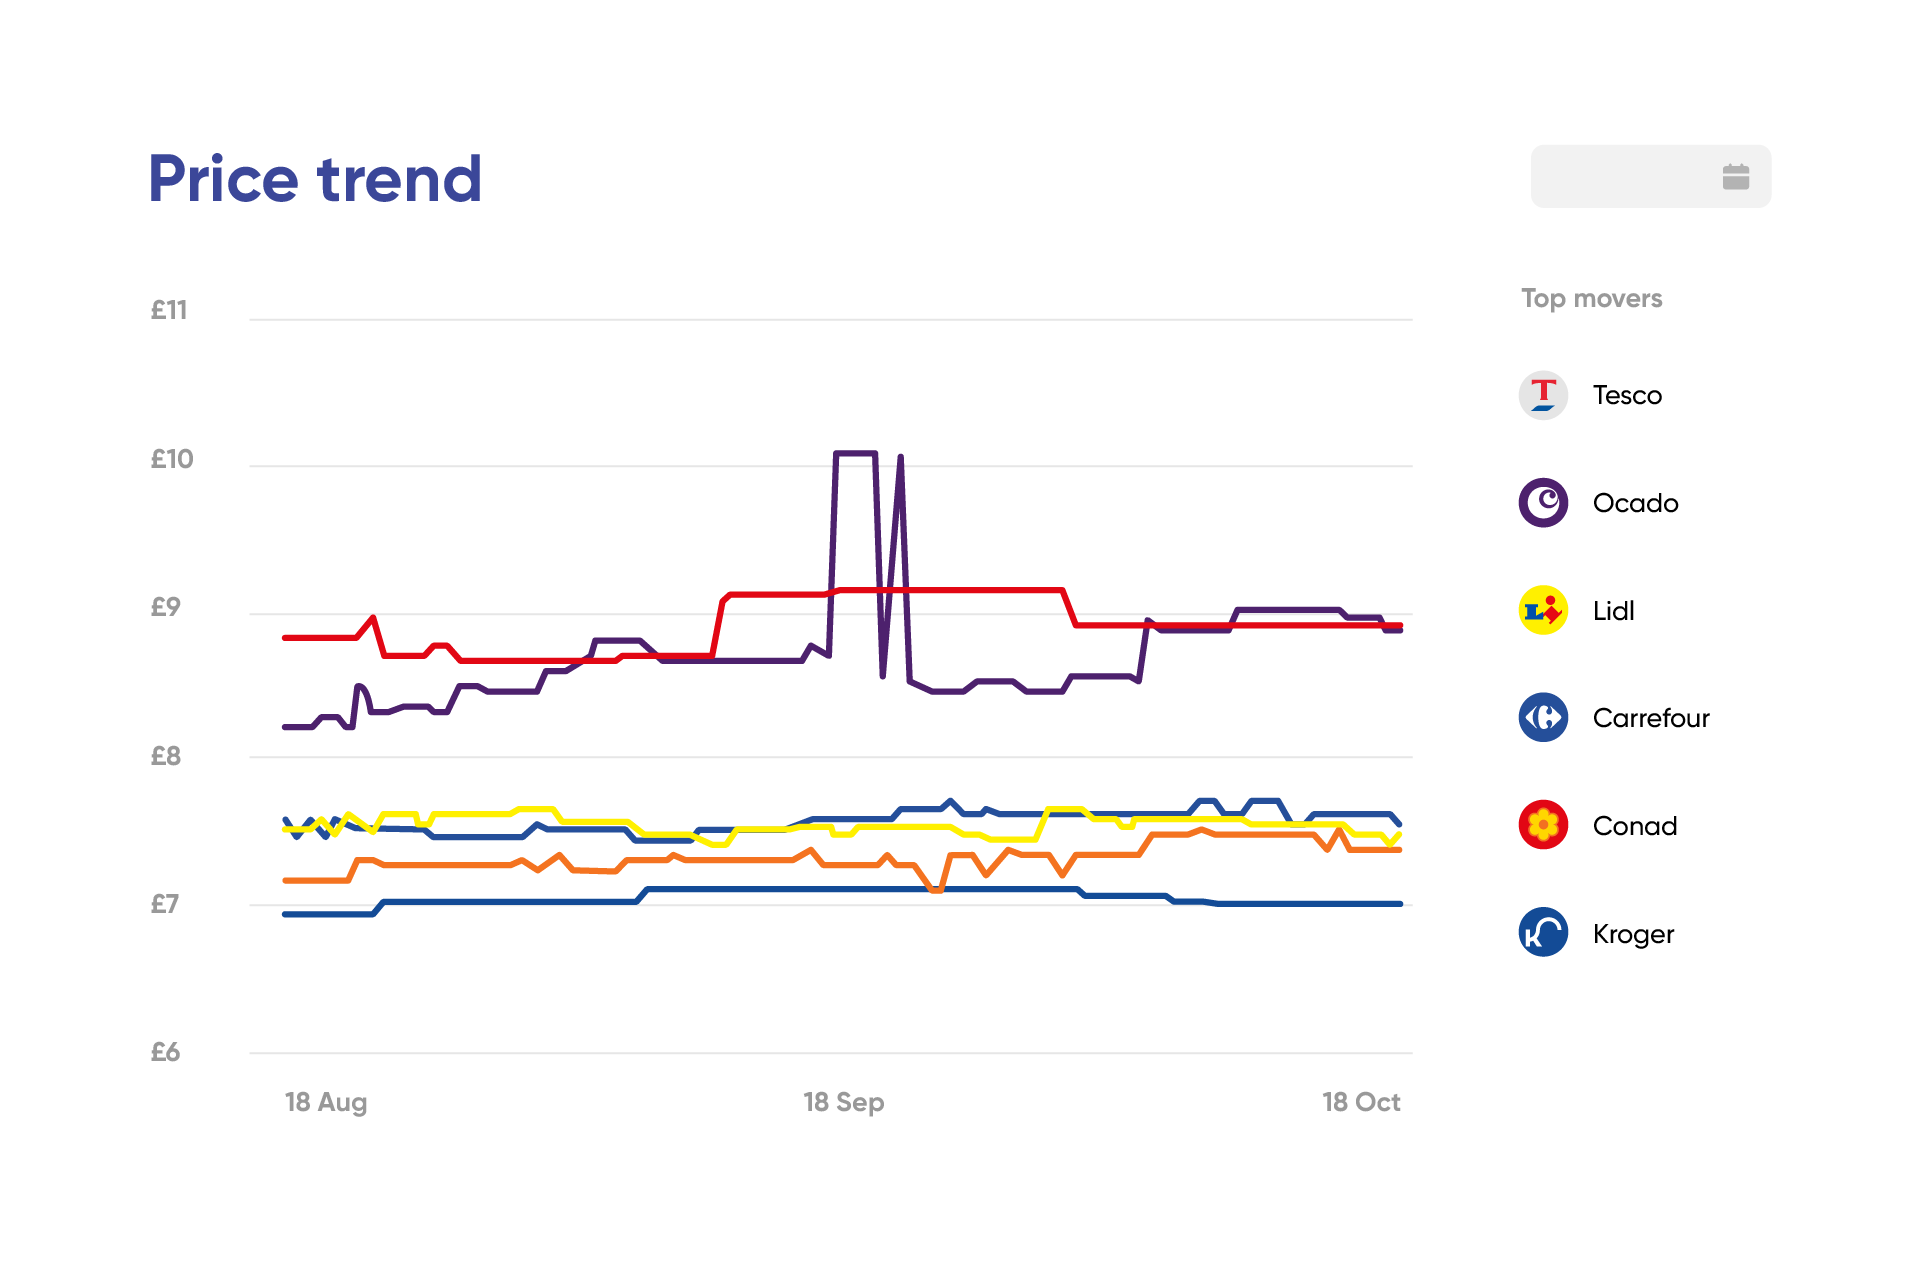
Explore platformCompare current price + promo state vs. the same window last year. The biggest deltas show where forecast risk is concentrated.
A weekly variance view contrasts planned vs. actual promo depth and duration across retailers.
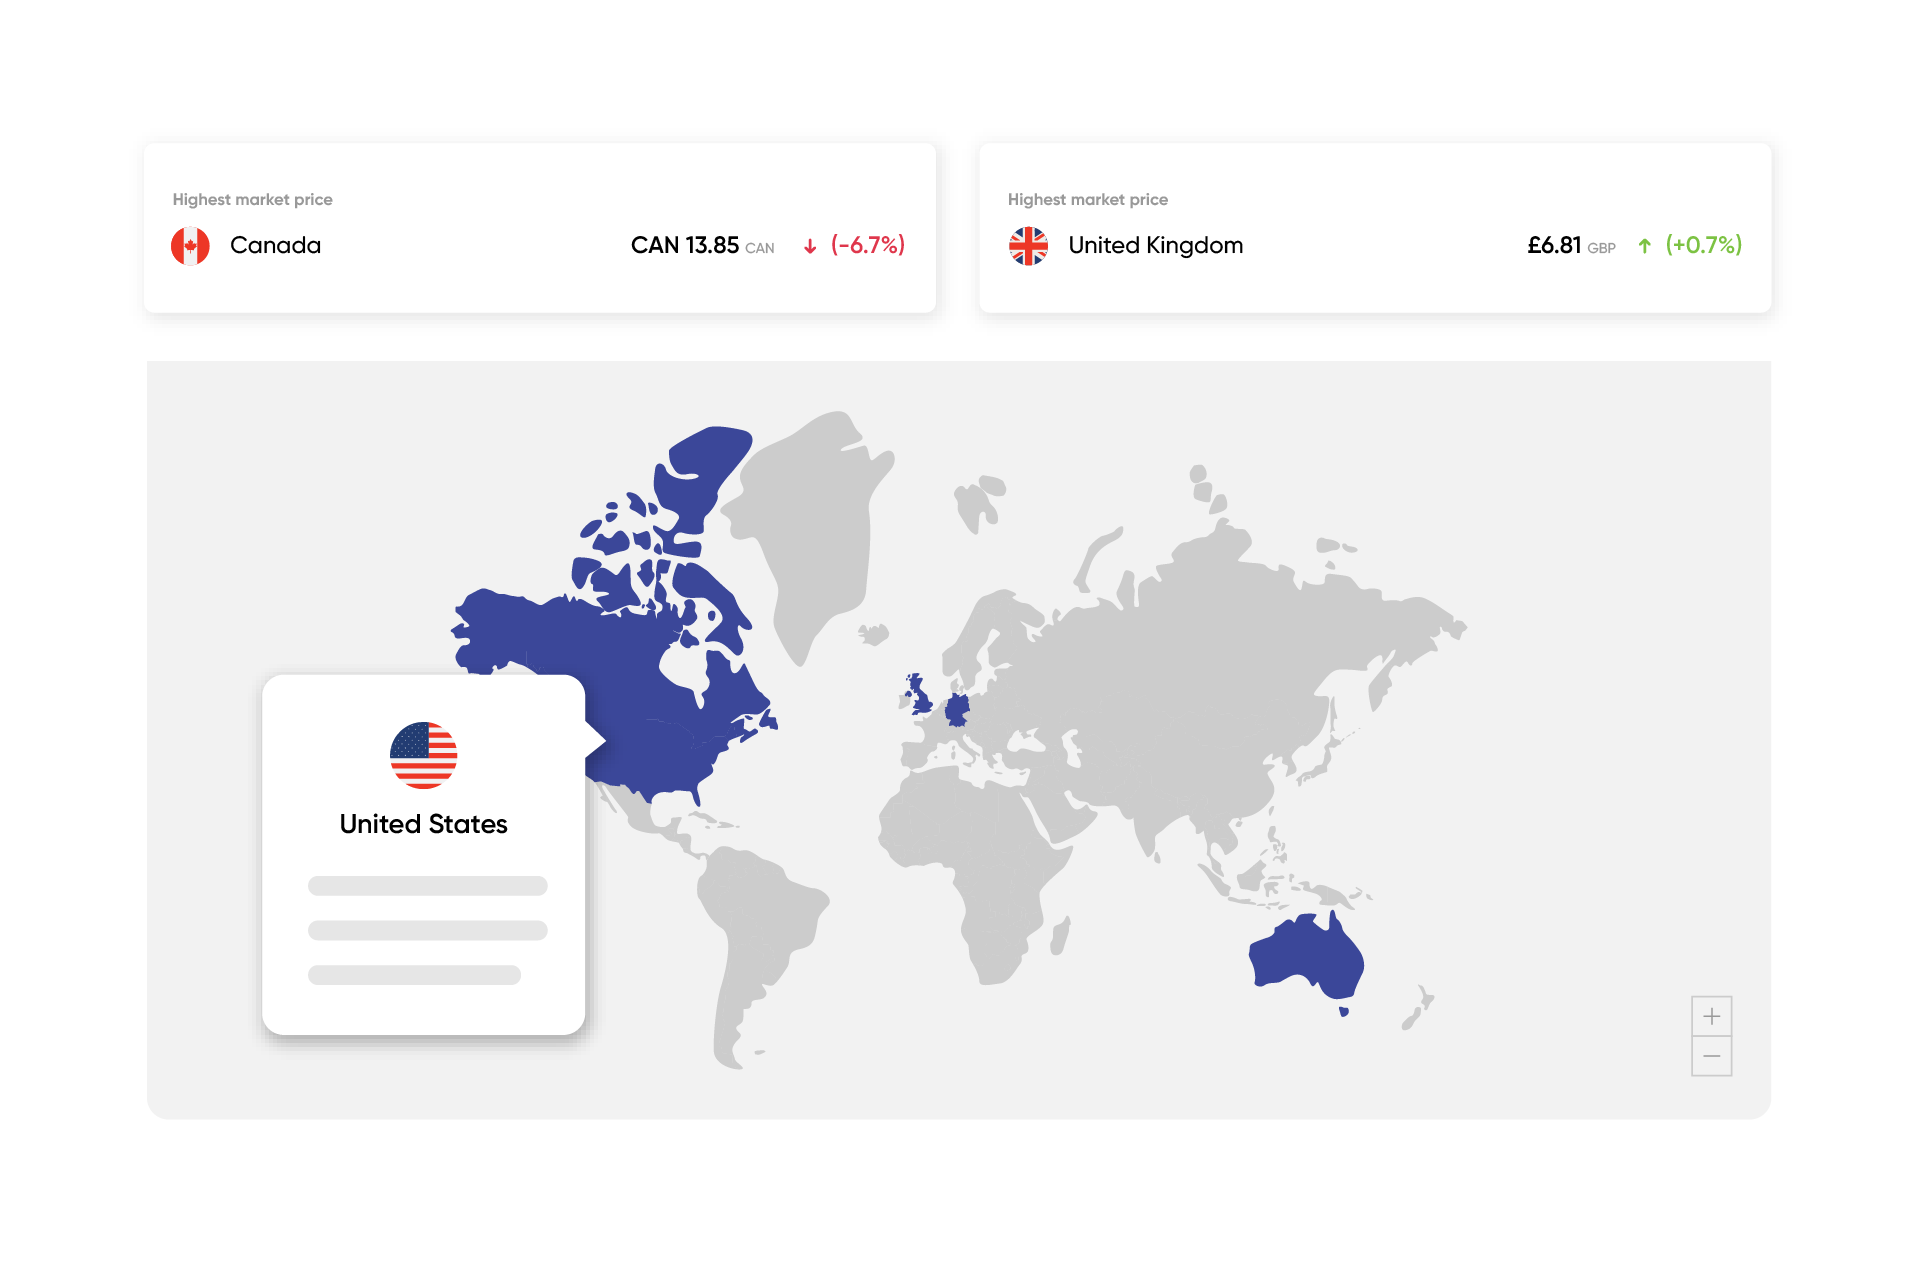
Track cross-market parity for every SKU. The drift report shows where price has diverged most relative to last quarter.
Retailer feeds refresh daily. The dashboard timestamps every data point so you know whether to act today or wait for tomorrow.
Walk into JBPs with the numbers the buyer is using. See what each retailer is asking for, where you under-index, and where you can hold the line.
Explore platformA per-retailer comparison highlights the SKUs where your prices, promos and listings are weakest vs. the rest of the category.
Listing-share by retailer + category, refreshed daily. Spot delisting risk before the buyer raises it.
Promo P&L view models depth + duration against historic uplift to put a number on each ask.
Quarterly trend dashboard rolls up listings, share-of-shelf, price and promo into one trajectory per retailer.
Walk into JBP meetings with the same data the buyer is using. Range, price, promo, all current.
Explore platformA delisting-risk model combines availability, share of shelf and search rank trends to flag SKUs sliding off retailer ranges.
Range gap analysis cross-references your portfolio with the live retailer range, by category and price band.
Category-level promo performance combines depth, frequency, share-of-shelf and rank movement during each promo window.
Daily anomaly detection flags SKUs with prices that diverge from category benchmarks beyond a configurable threshold.
Catch broken images, missing copy, OOS and search-rank drops before they hit your KPIs.
Explore platformA PDP scorecard blends content completeness, image count, review score and rank for every SKU in scope.
Live availability across every retailer.com surface, with the hour of the day each SKU went OOS.
Review monitoring extracts negative-sentiment claims by SKU, retailer and date so quality teams see the trend, not the noise.
Search-rank timeline overlays your campaigns, retailer promo events, and competitor moves on one chart.
Track retail media spend, search rank and share-of-shelf on every retailer.com that matters. Find the gaps before the agency does.
Explore platformDaily share-of-shelf for every category and retailer in your remit, including PDP, search and listing variants.
Retail media monitoring shows ad placements, frequencies and positions across retailer.com surfaces, by brand and SKU.
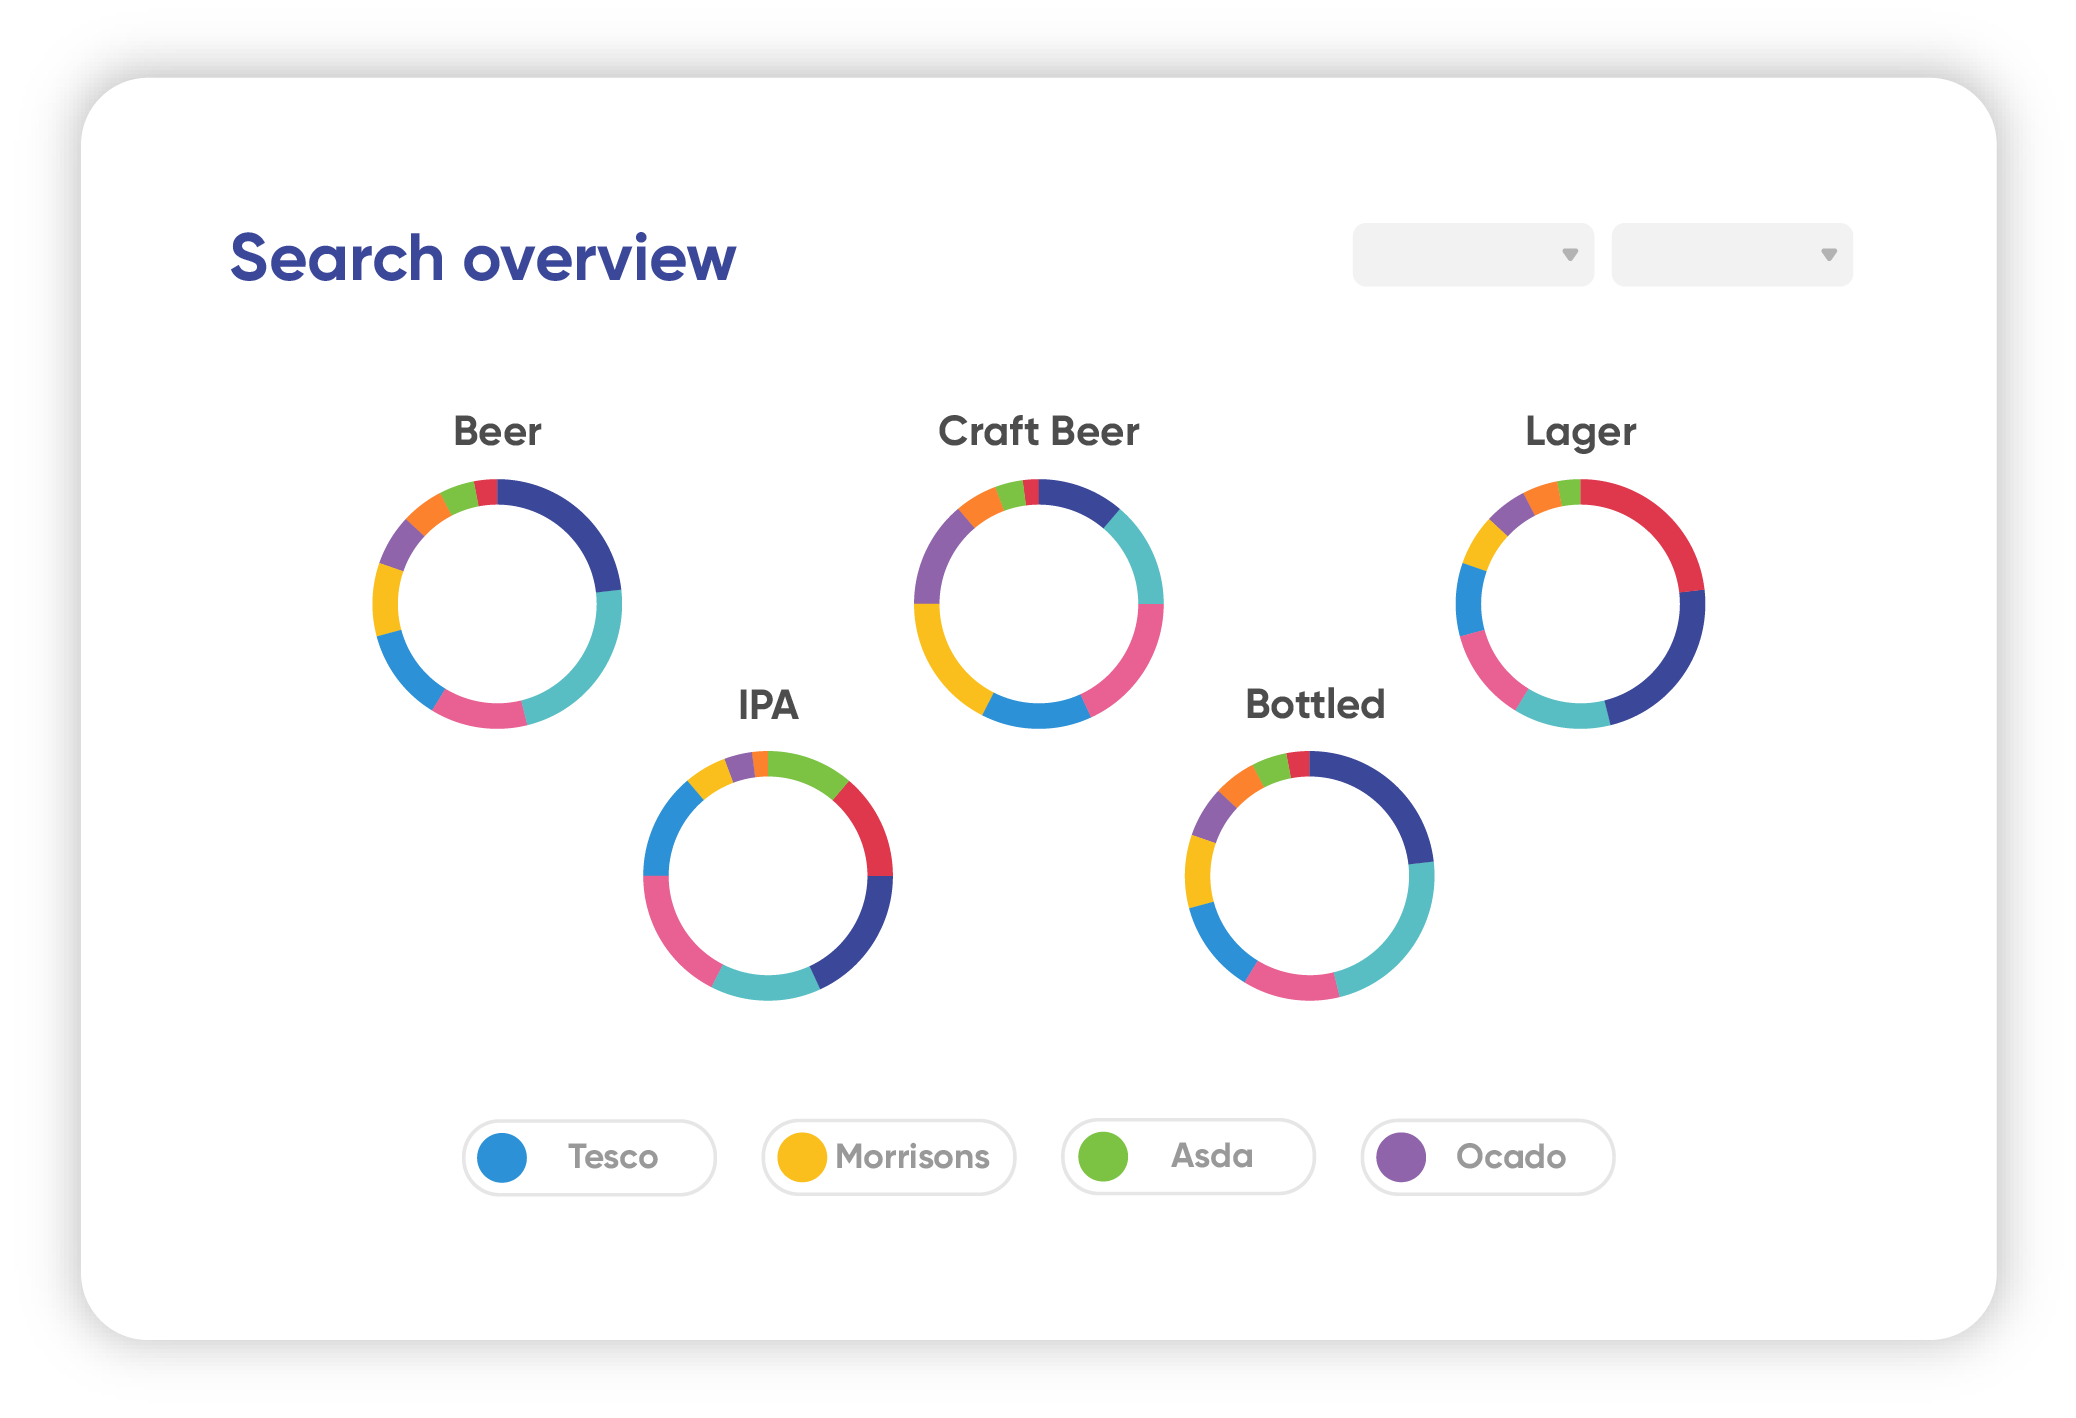
Search overview tracks rank for every keyword you care about, on every retailer, with day-on-day movement.
Campaign performance overlays search rank, share of shelf and stock state with your activation calendar.
Help your category managers, buyers and trading teams enter every supplier conversation with the same market view their suppliers already have.
Explore platformDaily cross-retailer price benchmarks for every category, with the size of the gap and the SKUs driving it.
Cross-supplier promo intensity tracking surfaces every active mechanic across the market, by category and brand.
Digital shelf benchmarks for every category, including content completeness, search rank and OOS rate.
Listing-share + share-of-shelf trended over time so you can spot range gaps before they become long-term losses.
